Now Reading: Business Intelligence vs Data Analytics: What’s the Difference?
-
01
Business Intelligence vs Data Analytics: What’s the Difference?


What BI Is and How It Serves the Organization
BI is the discipline focused on turning data into reliable, timely information that supports day-to-day and strategic decision-making through dashboards, reports, and governance structures. It centers on providing access to trusted data, standardized metrics, and repeatable outputs that managers and executives can rely on to steer operations, allocate resources, and monitor performance. In practice, BI consolidates data from multiple sources—such as transactional systems, CRM, and finance platforms—into a coherent, governed view that surfaces the most important signals for the business. It emphasizes consistency, cost-efficient distribution, and the ability to scale reporting across departments and regions.
Because BI prioritizes governance, consistency, and speed of delivery, it is well suited for routines like monthly performance reviews, quarterly forecasts, and operational dashboards that require minimal interpretive friction. The goal is not to solve every unknown, but to provide a trusted lens on the business so decisions can be made quickly and with confidence. BI initiatives also typically invest in data quality, lineage, security, and role-based access so stakeholders see the right information in the right context, reducing the risk of misinterpretation or misinference.
- Interactive dashboards that update with real-time or near-real-time data
- Standardized reports and scorecards for governance and accountability
- Self-service access for business users with guided data discovery
- Data governance, lineage, and quality controls that ensure trust
What Data Analytics Entails
Data analytics concentrates on deeper exploration, hypothesis testing, modeling, and optimization to derive insights that explain why something happened, forecast what will happen, and suggest actions to influence outcomes. It leverages statistical methods, experimentation, and sometimes machine learning to uncover hidden patterns, validate assumptions, and build models that inform strategic and operational decisions. While BI provides a stable, repeatable view of the business, analytics asks tougher questions and uses more expressive techniques to quantify drivers, quantify risk, and simulate potential futures. In effect, analytics turns data into evidence that supports strategic experimentation and proactive decision-making.
Analytical work commonly progresses from descriptive summaries through diagnostic analysis, predictive forecasting, and prescriptive optimization. Each stage adds sophistication, requiring broader data access, stronger data preparation capabilities, and more specialized skill sets. As analytics matures, teams increasingly automate parts of the process, embed insights into operational workflows, and measure the impact of predictive or prescriptive recommendations in real business contexts.
- Descriptive analytics: summarizing what happened through metrics and visualizations
- Diagnostic analytics: testing hypotheses about why something happened, often using cohorts and causal reasoning
- Predictive analytics: forecasting future outcomes using statistical models and machine learning
- Prescriptive analytics: recommending actions and evaluating trade-offs through optimization and simulation
How BI and Data Analytics Complement Each Other
In practice, BI and data analytics are complementary rather than mutually exclusive. A well-structured BI platform can host dashboards that embed analytics outputs, alerts, and automated recommendations, providing a stable delivery layer that business users rely on every day. Analytics initiatives benefit from this foundation because governance, data quality, and scalable access to data ensure that insights can be trusted and scaled without fragmenting the data ecosystem. The most resilient organizations design their data programs so insights produced by analytics flow seamlessly into BI dashboards and decision-support tools.
As maturity grows, analytics results are operationalized through BI channels: dashboards that monitor model performance, embedded scores in transactional systems, and self-service interfaces that empower business users to explore what-if scenarios while preserving governance. This integration helps shorten the cycle from insight to action and supports consistent interpretation of data-driven recommendations across teams. The outcome is a cohesive data environment where BI provides stability and analytics provides depth.
Choosing Between BI and Data Analytics: A Practical Guide
A pragmatic approach to tool selection starts with the decision horizon and the primary user needs, then layers in data maturity, governance constraints, and the speed at which insights must be produced. If stakeholders primarily require clear, repeatable reporting and a governed set of metrics, BI typically forms the foundation, enabling reliable performance tracking and operational visibility. If stakeholders need to explore data, test hypotheses, and build models that forecast outcomes or optimize decisions, data analytics capabilities become essential, often driving experimentation and continuous improvement.
Organizations commonly adopt an integrated approach: establish a solid BI layer for reporting and governance, and progressively extend that layer with analytics capabilities that feed dashboards and alerts. A phased plan reduces data silos, minimizes duplicate data work, and ensures that analytics outputs are consumable and trustworthy. The result is a scalable, data-driven program that can evolve from descriptive reporting to advanced prescriptive insights over time.
- Primary objective: reporting and governance → BI
- Primary objective: exploration, hypothesis testing, and modeling → data analytics
- Data maturity and governance constraints influence approach and tooling
- Roadmap: start with BI foundations, then incrementally add analytics capabilities and data science skills
Data Maturity, People, and Process Implications
Beyond technology, the success of BI and analytics programs hinges on people, processes, and governance. Clear role definitions—BI developers, data engineers, data analysts, and data scientists—combined with cross-functional collaboration patterns help transform data into value. A robust data governance framework, including data catalogs, lineage tracing, and quality controls, is essential as analytics workloads scale and data sources multiply. Cultivating data literacy across the organization—so business users can interpret dashboards and engage with analytical outputs confidently—further strengthens the impact of both BI and analytics efforts.
Leaders should plan for the operational realities of both disciplines: scalable data pipelines, governance-compliant platforms, and sustainable funding that supports ongoing data quality improvements, tool optimization, and talent development. By aligning people, processes, and technology, organizations can deliver consistent insight at scale while remaining responsive to changing business needs.
What distinguishes BI from data analytics?
BI focuses on reliable reporting, dashboards, and governance to support ongoing decision-making, while data analytics emphasizes deeper exploration, hypothesis testing, modeling, and optimization to uncover causes and predict outcomes. BI tends to be more standardized and scalable, whereas analytics is more experimental and model-driven.
Can BI and data analytics be combined in a single program?
Yes. A mature data program integrates BI as the delivery layer for widely used reports and dashboards, while analytics informs and augments those outputs with predictive indicators, scenario analysis, and prescriptive insights. The key is to align data infrastructure, governance, and roles so insights can flow from exploration to action without fragmentation.
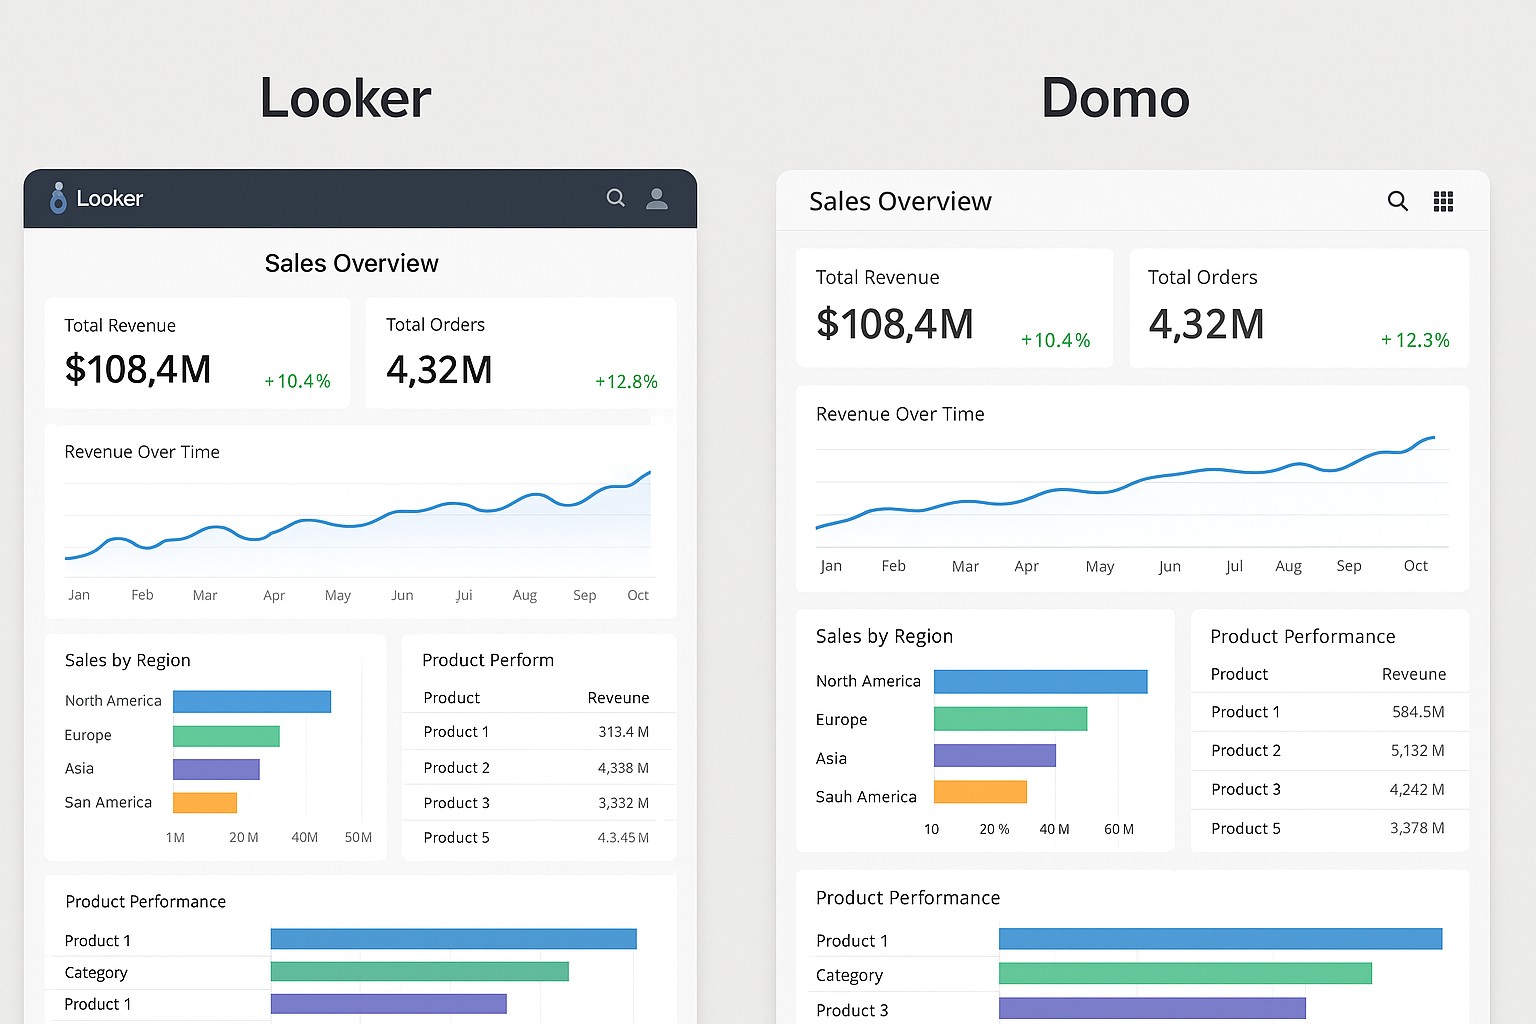
What typical tools are used for BI vs analytics?
BI tools commonly include dashboards and reporting platforms, data visualization, and governance features for organizing and governing data assets. Analytics tools span statistical programming, machine learning environments, experimentation platforms, and data science notebooks. In practice, many organizations use overlapping toolchains and prioritize interoperability and data quality over tool selection for its own sake.
What indicators signal a need to upgrade BI infrastructure?
Indicators include slower dashboard load times at scale, fragmented data sources, inconsistent metrics, limited self-service capabilities, and governance gaps that hinder data trust. If business users repeatedly request new reports or if critical decisions rely on manual workarounds, it may be time to invest in BI modernization and data governance improvements.
How long does it take to implement BI and analytics capabilities?
Timeline varies by data maturity, scope, and organizational readiness, but typical programs span several quarters to a couple of years. A phased approach that starts with a solid BI foundation and incrementally adds analytics capabilities—while building data pipelines, governance, and literacy—tends to deliver steady value without overwhelming teams.