")
Understanding dashboard goals and audience Effective dashboards are not mere collections of numbers; they are decision-support systems that guide action. Before you design a single visualization, articulate the core question
Discover expert insights and practical guides in Data Analytics & Business Intelligence. Learn key trends, tools, and strategies to improve your skills and drive business results.
Understanding dashboard goals and audience Effective dashboards are not mere collections of numbers; they are decision-support systems that guide action. Before you design a single visualization, articulate the core question

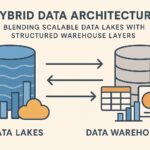
Foundations of the Data Lakehouse The data lakehouse represents an evolution in how organizations store, process, and analyze data. It combines the scalable, low-cost storage and raw data flexibility of

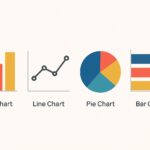
The purpose of data visualization and its business impact Data visualization translates numeric data into visual representations that humans can interpret quickly. In business contexts, charts are not decorative; they

Strategic Value of Predictive Analytics in Healthcare Predictive analytics in healthcare is increasingly framed as a strategic capability that aligns clinical excellence with operational efficiency. By transforming historical and real-time

Descriptive Analytics: Understanding the Past to Inform the Present Descriptive analytics focuses on summarizing historical data to reveal what has happened in the business. It answers questions like what happened,

Prometheus alternatives landscape The rise of distributed systems and cloud-native architectures has stretched the capabilities of any single monitoring tool. While Prometheus remains a foundational component for many teams, organizations

Understanding Churn and the Value of Analytics Churn refers to the loss of customers over a defined period, and it is a fundamental signal of product-market fit, customer satisfaction, and

What is Composable Analytics? Composable analytics is a design philosophy for business intelligence that treats analytics capabilities as modular, plug-and-play components rather than a single monolithic stack. Instead of bundling

Understanding Interactive Data Visualization Interactive data visualization refers to the practice of presenting data through graphical representations that respond to user input. Rather than delivering a static image or chart,

What BI Is and How It Serves the Organization BI is the discipline focused on turning data into reliable, timely information that supports day-to-day and strategic decision-making through dashboards, reports,