Now Reading: Real-Time Dashboards: Enabling Live Data Insights
-
01
Real-Time Dashboards: Enabling Live Data Insights
Real-Time Dashboards: Enabling Live Data Insights

Real-Time Dashboards: What They Are and Why They Matter
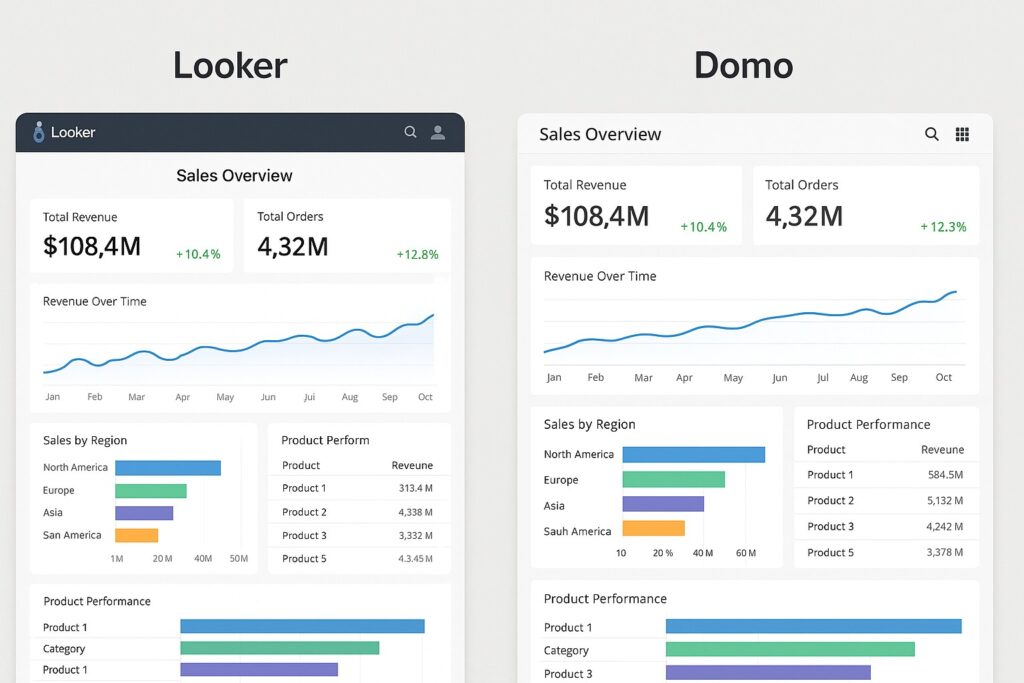
Real-time dashboards are interfaces that pull streams of data in near real time and present them as continuously updating visuals. They transform raw events into actionable insights by aggregating, filtering, and highlighting the most important signals as they occur. In practice, this means seeing system health, user behavior, and operational performance evolve as events happen, rather than waiting for nightly reports or batch refreshes. This immediate feedback loop supports a more responsive and data-informed organization.
For business teams, real-time dashboards enable faster decision-making, earlier anomaly detection, and tighter operational control. They close the loop between data science, operations, and frontline teams by surfacing trends, outliers, and opportunities as soon as they emerge. The ability to monitor live performance—such as conversion rates during a marketing campaign, server latency during peak load, or real-time inventory movements—helps executives, product managers, and operators intervene before issues escalate and before opportunities slip away. The added visibility also supports continuous experimentation, enabling rapid hypothesis testing and validation with up-to-date signals.
Achieving effective real-time dashboards requires careful consideration of data freshness, latency budgets, and the distinction between event time and processing time. Freshness is not just about speed; it’s about ensuring the observed values accurately reflect when events occurred, not merely when they were processed. Teams must balance the desire for immediacy with the need for data quality, deduplication, and consistency across data sources. The design decisions made at ingestion, processing, and visualization layers determine whether the dashboard accelerates learning or simply amplifies noisy signals.
- Faster decision-making and shorter cycles for operational responses
- Real-time anomaly detection and alerting to IPC (incident prevention) workflows
- Improved operational visibility across applications, services, and business units
- Real-time customer experience insights and near-instant feedback loops
- Continuous trend monitoring and rapid hypothesis testing
Architectural Considerations for Streaming Data
Building effective real-time dashboards starts with a robust architecture for capturing, processing, and presenting streaming data. The ingestion layer must support high volume, low latency, and reliable delivery, often leveraging message buses or streaming platforms that guarantee at-least-once or exactly-once processing semantics. Designing with idempotent producers, durable topics, and well-defined schemas reduces duplication and corruption as data moves from source systems to downstream consumers. Data modeling at this stage should align with the dashboard’s needs, prioritizing aggregations and time-series representations that can be computed efficiently.
The processing layer handles the transformations required to turn raw events into dashboard-ready metrics. This includes windowing strategies (tumbling, sliding, or session-based), handling late-arriving data, and choosing between true streaming or micro-batch processing depending on latency requirements. Event-time processing helps preserve the order of events and minutes or seconds in the data stream, which is crucial for accurate time-based visualizations. Operators should design for backpressure, fault tolerance, and deterministic results so dashboards remain stable under load and during partial outages.
On the storage and presentation side, choose a architecture that supports fast reads for dashboards while preserving the ability to trend historical data. Time-series databases, columnar data warehouses, and scalable data lakes are common choices, often used in combination with streaming pipelines to stage and enrich data before visualization. Visualization layers should provide intuitive, role-based access to dashboards, with clear lineage and provenance so analysts can trace a metric back to its source. Data quality checks, schema validation, and lineage tracking help maintain trust as data flows through the system and across teams.
- Ingestion, streaming, and messaging components with durable, scalable design
- Processing engines capable of event-time semantics and windowed computations
- Storage and visualization layers that support fast querying, strong lineage, and governance
Designing for Reliability, Scalability, and Governance
Real-time dashboards demand reliability and scalability to avoid blind spots during peak load or system failures. Implement fault-tolerant pipelines with replayable streams, checkpointing, and graceful degradation so dashboards continue to function even when upstream systems experience issues. Autoscaling, circuit breakers, and backpressure-aware components help ensure that dashboards remain responsive under varying traffic patterns and data volumes. Establish clear service level objectives for data freshness, latency, and availability, and monitor them continuously to detect drift or degradation.
Observability is essential for maintaining confidence in live dashboards. Instrument dashboards themselves with telemetry: track ingestion latency, processing time, query performance, and end-to-end user experience. Regularly review dashboards for data freshness and correctness, and incorporate synthetic monitoring where real events are insufficient to validate ongoing performance. Operational dashboards should themselves be governed by standard change-control processes so that updates to metrics, definitions, or visualization logic are controlled, tested, and auditable.
Governance and security practices ensure that real-time insights stay appropriate for the audience and compliant with corporate policy and privacy requirements. Enforce role-based access control, manage sensitive data with masking or redaction where needed, and implement retention policies that align with regulatory needs. Data lineage and provenance become increasingly important as data flows across services and teams, enabling auditors and stakeholders to understand how a metric was produced and why it changed.
- Monitoring, alerting, and automated recovery to minimize downtime
- Data quality checks, reconciliation, and anomaly auto-detection
- Change management, access control, and data retention policies
Use Cases Across Industries
Real-time dashboards unlock value across a broad range of domains. In e-commerce and digital media, they reveal how campaigns and content influence user behavior in near real-time, enabling rapid optimization of channels, pricing, and recommendations. In manufacturing and supply chain, live dashboards monitor equipment health, process throughput, and inventory movements to prevent bottlenecks and reduce downtime. In financial services and telecom, streaming analytics support fraud detection, capacity planning, and service-level management with immediate visibility into anomalies and performance shifts. Across these sectors, the common thread is the ability to observe the immediate impact of decisions and to adjust course before issues escalate.
Operational teams use real-time dashboards to run daily rituals with greater rigor. They track service health metrics, incident response times, and throughput trends to fine-tune capacity and resilience. Product and marketing teams leverage live insights to measure experiments, monitor funnel progression, and course-correct campaigns as conditions evolve. Data engineers and analysts focus on optimizing pipelines, reducing end-to-end latency, and ensuring data governance practices keep pace with rapid data flows. The practical value emerges when dashboards become a trusted, timely source of truth that informs everyday actions.
To maximize value, organizations should align dashboards with business objectives and ensure teams share a consistent vocabulary for metrics and dimensions. By defining standard metrics, time windows, and aggregation rules, stakeholders can compare results across teams and time periods with confidence. Combining real-time signals with historical context through hybrid dashboards provides the most robust picture: you can react to the present while understanding the longer-term trajectory.
- E-commerce and marketing: optimization of campaigns, pricing, and recommendations in real time
- Operations and manufacturing: live monitoring of throughput, defects, and uptime
- Finance and risk: streaming anomaly detection and capacity planning
Operational Practices and Governance for Real-Time Dashboards
Effective real-time analytics require disciplined operational practices. Establish a regular cadence for validating data freshness, reviewing metric definitions, and updating dashboards to reflect evolving business needs. Implement automated data quality checks that run continuously and surface issues promptly. Embed governance controls to prevent scope creep, ensure consistent use of dimensions and filters, and maintain an auditable trail of changes to dashboard configurations.
Security and privacy should be baked into the dashboard lifecycle. Enforce least-privilege access, encrypt sensitive data in transit and at rest, and apply data masking where appropriate. Define retention periods for different data types and implement automated purging when required. Routine audits, version control for dashboard configurations, and rigorous change management help maintain trust in live analytics while supporting compliance requirements.
In practice, teams should invest in training, documentation, and standardized playbooks for incident response related to real-time dashboards. This includes clearly defined escalation paths, runbooks for common failure modes, and rehearsals for high-severity events. By combining robust architecture with disciplined operations, organizations can sustain the reliability and usefulness of real-time dashboards over time.
- Monitoring, alerting, and proactive remediation to minimize disruption
- Regular data quality validation and governance alignment
- Documentation, training, and incident response playbooks for rapid recovery
FAQ
What is the typical latency of a real-time dashboard?
In practice, latency targets depend on the business case, data source characteristics, and the acceptable freshness for decision-makers. Many real-time dashboards aim for sub-minute latency, with streaming pipelines delivering data within seconds of the event and visualizations refreshing continuously or on near-real-time intervals. It’s important to define an acceptable latency budget for each metric and to design the pipeline to meet or exceed those expectations through optimized ingestion, efficient processing, and fast query paths. Trade-offs often exist between latency, accuracy, and throughput, so clear prioritization is essential.
How do you ensure data quality in streaming dashboards?
Data quality in streaming dashboards is achieved through a combination of schema validation, deduplication, watermarking for late data, and reconciliation against trusted sources. Idempotent producers, exactly-once processing semantics where feasible, and rigorous monitoring of ingestion latency and data loss help prevent misleading visuals. Establishing test data, automated anomaly detectors, and explicit data quality rules also helps catch issues early and maintain user trust in live insights.
What governance considerations matter for live dashboards?
Governance for real-time dashboards centers on access control, data lineage, and data retention. Implement role-based permissions, ensure sensitive data is masked or restricted, and keep an auditable record of changes to dashboards and data sources. Data lineage tools help analysts trace a metric back to its origin, which is critical for audits and for understanding how changes in pipelines affect visuals. Retention policies should balance business value with privacy and regulatory requirements, including data minimization and timely purging of stale information.
What are common failures and how can they be mitigated?
Common failures include data outages, late-arriving events, backpressure-induced latency, and misconfigurations in aggregation logic. Mitigation strategies include designing with fault-tolerant streaming architectures, implementing idempotent and replayable pipelines, applying backpressure-aware processing, and conducting regular disaster recovery drills. Automated health checks, synthetic monitoring, and robust incident response plans reduce downtime and help teams recover quickly when issues arise.
