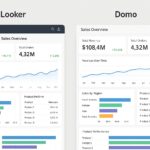
Overview: Looker vs Domo in the BI landscape Looker and Domo sit at the intersection of data visualization, analytics, and decision intelligence for modern organizations. Looker, now part of Google
Discover expert insights and practical guides in Data Analytics & Business Intelligence. Learn key trends, tools, and strategies to improve your skills and drive business results.
Overview: Looker vs Domo in the BI landscape Looker and Domo sit at the intersection of data visualization, analytics, and decision intelligence for modern organizations. Looker, now part of Google

What BI Is and How It Serves the Organization BI is the discipline focused on turning data into reliable, timely information that supports day-to-day and strategic decision-making through dashboards, reports,

Overview of AI-powered dashboards AI-powered dashboards blend data visualization with machine learning to turn raw data into actionable intelligence. They move beyond static charts by detecting patterns, trends, and anomalies

Introduction In today’s enterprise analytics landscape, Amazon QuickSight and Tableau are two of the most frequently evaluated tools. QuickSight is tightly integrated with the AWS ecosystem and is designed to

Kibana (Elasticsearch) Kibana is the visualization layer of the Elastic Stack, commonly deployed where data already resides in Elasticsearch. It serves as a Grafana-like dashboarding option with a strong emphasis

What is a Histogram? A histogram is a graphical tool designed to convey the distribution of a numeric variable by grouping data into intervals, or bins, and showing how many

Overview of OEM analytics and white-label BI OEM analytics, often referred to as white-label BI, is a strategic approach in which software vendors incorporate analytics capabilities directly into their product
")
Overview of Manufacturing Dashboard Examples for Production and Operations Modern manufacturing environments increasingly rely on data-driven visualization to translate streams from shop floor systems into actionable insight. A well-designed dashboard

What is self-service analytics? Self-service analytics describes an operating model in which business users can access data, prepare it, and generate insights without needing to wait for central IT to
")
Introduction: the cost of bad visuals in business decisions In business contexts, data visuals are tools for rapid comprehension and informed action. When they work well, dashboards and charts accelerate