Now Reading: E-commerce & Retail Dashboard Examples (Sales & Customer Insights)
-
01
E-commerce & Retail Dashboard Examples (Sales & Customer Insights)

")
Overview: E-commerce & Retail Dashboards as Decision Tools
In e-commerce and retail, dashboards transform streams of transactions, interactions, and inventory activity into decision-ready insight. They bring together sales performance, customer behavior, and stock health so leaders can diagnose tendencies, validate initiatives, and course-correct merchandising in near real time. For practitioners, dashboards answer questions like which channels drive growth, how promotions perform, and where inventory risks lie, all in a format that mirrors business workflows.
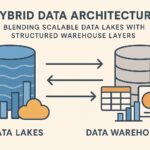
Typically these dashboards aggregate data from multiple sources—ERP, ecommerce platforms, marketplaces, CRM systems, and offline POS—into a consolidated view via a data warehouse, data lake, or virtualization layer. Visualization tools enable slicing by channel, geography, product family, and time period, while governance layers ensure consistency in definitions and calculations. The examples that follow illustrate how dashboards support sales optimization, marketing experimentation, and inventory decisions across channels and stores.
Key Metrics Driving Sales and Customer Insights
Choosing the right metrics is the first step toward dashboards that inform action rather than merely reporting numbers. In retail contexts, metrics are often interconnected; changes in traffic or price can cascade into conversion, cart size, and loyalty signals. A practical dashboard foregrounds a concise set of core indicators while still exposing deeper detail for drill-down when needed.
Beyond raw totals, modern dashboards emphasize efficiency, profitability, and customer lifetime value. They enable product teams and store operators to link top-line performance to promotions, assortment choices, and channel mix. The following metric set reflects common priorities in e-commerce and brick-and-mortar environments, and serves as a baseline for benchmarking across periods and cohorts.
- Revenue and gross margin by channel, product category, and geography
- Conversion rate by channel and device, with checkout funnel steps
- Average order value (AOV) and basket size trends
- Cart abandonment rate and recovery rate by touchpoint
- Traffic sources, sessions, and new vs returning visitors
- Customer acquisition cost (CAC) and marketing efficiency
- Customer lifetime value (CLV) and repeat purchase rate
- Return rate and reasons by product and channel
- Sell-through and inventory turnover by product line
- Stockout risk and aging inventory indicators
Dashboard Design Principles for Actionable Insights
Design quality is integral to comprehension and trust. Dashboards should reveal the right story at a glance, with an emphasis on clarity, consistency, and context. The goal is to reduce cognitive load so stakeholders can focus their analysis on root causes, opportunities, and risks rather than hunting for the data definitions behind the numbers.
Effective dashboards are aligned with business processes and decision workflows. They support standard operating rhythms such as daily standups, weekly planning, and monthly business reviews, while remaining flexible enough to accommodate ad hoc inquiries. Governance—clear definitions, version control, and user access rules—ensures comparability over time and across teams. The principles below guide practical design decisions.
Ultimately, the best dashboards reflect how teams operate and where decisions are made, not merely what happened in the past. When users can connect metrics to actions they take in the next sprint or promotion, dashboards become an integral part of performance improvement rather than a passive report.
- Start with user goals and the KPIs that matter to their role, then tailor views to those tasks.
- Align dashboards with business processes and decision cadences to minimize context switching.
- Prioritize clarity: minimize clutter, use consistent color semantics, and provide obvious emphasis on exceptions and outliers.
- Balance real-time insight with stable performance by choosing appropriate refresh rates and data granularity.
- Provide context and drill-down pathways so users can explore root causes without leaving the dashboard.
- Institute data governance, including definitions, lineage, and access controls, to maintain trust and comparability.
Use Case Highlights: Sales Performance & Customer Segmentation Dashboards
Across e-commerce and retail chains, a typical sales-performance dashboard combines multi-channel revenue with efficiency metrics to reveal where growth is highest and where margins compress. Such dashboards usually present time-series trends by channel, region, and product family, alongside heatmaps or sparklines that highlight turning points tied to promotions, price changes, or seasonal effects. The goal is to empower merchandising and marketing teams to optimize assortment, pricing, and channel mix in close alignment with demand signals.
Another common use case centers on customer segmentation and lifetime value. Dashboards in this space merge transactional data with behavioral signals—site visits, loyalty activity, and campaign responses—to categorize customers into cohorts. This enables marketers and merchandisers to allocate budgets, personalize experiences, and identify high-potential segments for retention programs. A well-constructed example also tracks acquisition efficiency, engagement depth, and the velocity of repeat purchases, creating a narrative of how the customer base evolves over time.
- Cross-channel revenue by channel (online, mobile, in-store, marketplaces) with a unified currency and period alignment
- Product-level performance, including top sellers, margin impact, and stock status indicators
- Customer segments and CLV trajectories, with guardrails for seasonality and promotions
- Campaign attribution and funnel progress, linking media spend to incremental sales
- Inventory health indicators such as stock on hand, turnover rate, and backorder risk
Implementation Patterns and Deployment Considerations
To realize durable dashboards in a retail or e-commerce organization, teams typically design a scalable data architecture, embrace repeatable ETL/ELT processes, and establish robust data governance. A practical setup often includes a centralized data warehouse or data lake, a semantic layer to standardize definitions, and a BI layer that supports self-service analytics while enforcing security constraints. Performance tuning, data freshness, and error handling are ongoing priorities that determine how actionable a dashboard remains through peak seasons and promotional cycles.
Operational success also hinges on enabling end users to act on insights. This means provisioning role-based access so executives see the high-level view while analysts can drill into raw transactions, and embedding dashboards into daily workflows via portals, collaboration spaces, or integration with planning and execution systems. Training and change management matter as much as technology, ensuring that users interpret metrics consistently and follow established escalation paths when deviations appear. In practice, effective dashboards embody both rigorous data practices and pragmatic design that respects real-world decision timelines.
FAQ
What are essential metrics for e-commerce dashboards?
Essential metrics center on revenue, conversions, and customer value, but they should be contextualized by channel and time. Core indicators include revenue, gross margin, conversion rate, AOV, cart abandonment, traffic, CAC, CLV, repeat purchase rate, return rate, inventory turnover, and stockout risk. Coupled with these, dashboards typically provide trend lines, cohort analyses, and benchmarks to reveal performance against goals and prior periods.
How can dashboards improve merchandising decisions?
Dashboards translate assortment choices, promotions, and price strategies into observable effects on revenue, margin, and stock levels. By comparing performance across channels, regions, and product families, merchandisers can optimize which SKUs to feature, where to allocate shelf space, and when to run price tests. The ability to see cross-functional impacts—marketing spend, fulfillment costs, and inventory carrying costs—in one view accelerates evidence-based decisions and reduces guesswork.
What are best practices for real-time versus batched dashboards in retail?
Real-time dashboards are valuable for operational control during high-velocity events, but they demand robust data pipelines and filtering to avoid noise. Batched dashboards offer stability, wider context, and faster turnaround for strategic reviews. A practical approach blends both: use near-real-time views for critical processes such as live promotions or stock alerts, and rely on daily or hourly refreshes for longer-horizon planning and historical analysis.
How should data governance be applied to retail dashboards?
Governance ensures consistent definitions, data lineage, and secure access across teams. Create a glossary of KPIs, standardize transformation rules, and implement role-based permissions so sensitive data—like customer identifiers or pricing strategies— is protected. Regular data quality checks, audit trails, and versioned dashboards help teams trust the insights and avoid conflicts when models evolve or promotions change.
")